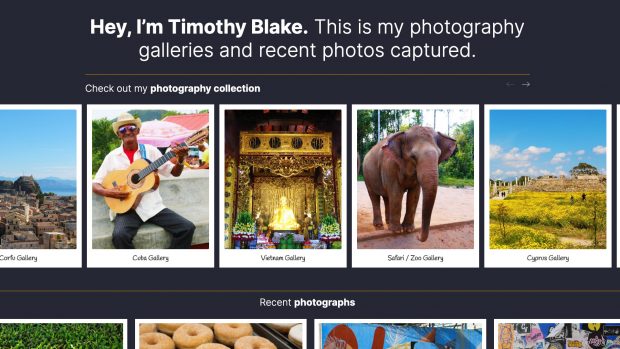
In preparation for the upcoming year, I have decided to give my photography page a refresh. This will allow me to showcase my work in a more up-to-date and visually appealing way. As a result, 2023 is going to be a busy year for my Canon camera.
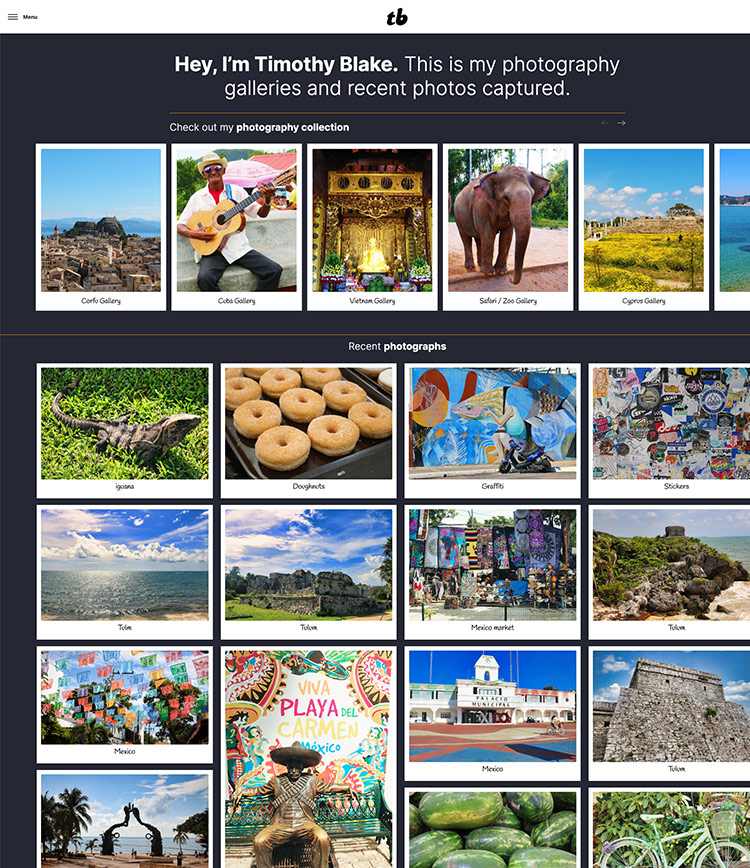
The updated website now features some of my photo albums from a few different countries that I have visited over the years. These albums showcase my growth as a photographer and my ability to capture the beauty of different cultures and landscapes. In addition, the second half of the page showcases my recent photography work, which I have taken and uploaded to my Flickr account. The dynamic nature of this section uses the Flickr API to instantly add any new photos that I upload to the page.
I am excited to continue sharing my passion for photography with others and look forward to capturing countless moments in the upcoming year. So please, watch this space, as 2023 is hopefully going to be a busy year filled with lots of moments which I will capture through the lenses of my Canon camera and share with you all through this refreshed photography page.
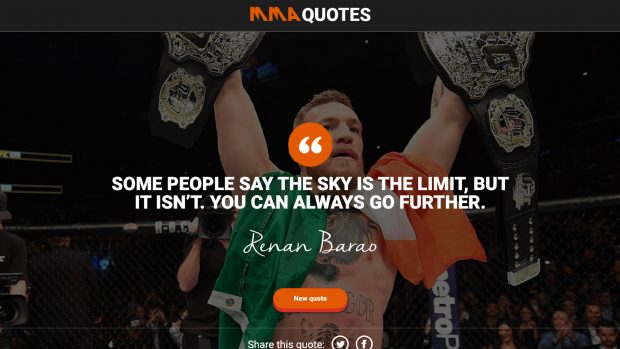
MMA Quotes is a website dedicated to showcasing inspirational quotes from press conferences and interviews with MMA fighters. The quotes, ranging from those by Ronda Rousey to the infamous Irish superstar Conor McGregor, are meant to inspire and motivate readers.
In addition to its collection of inspiring quotes, the website features a user-friendly interface that allows visitors to easily navigate through the site. The site also offers a unique feature where a new quote is displayed every time the page is refreshed, giving visitors a constantly changing source of inspiration.
To further enhance the user experience, the website includes social media icons at the bottom of the page, enabling visitors to instantly share their favorite quotes on Facebook or Twitter. The website is constantly being updated with new quotes and features to keep the content fresh and engaging.
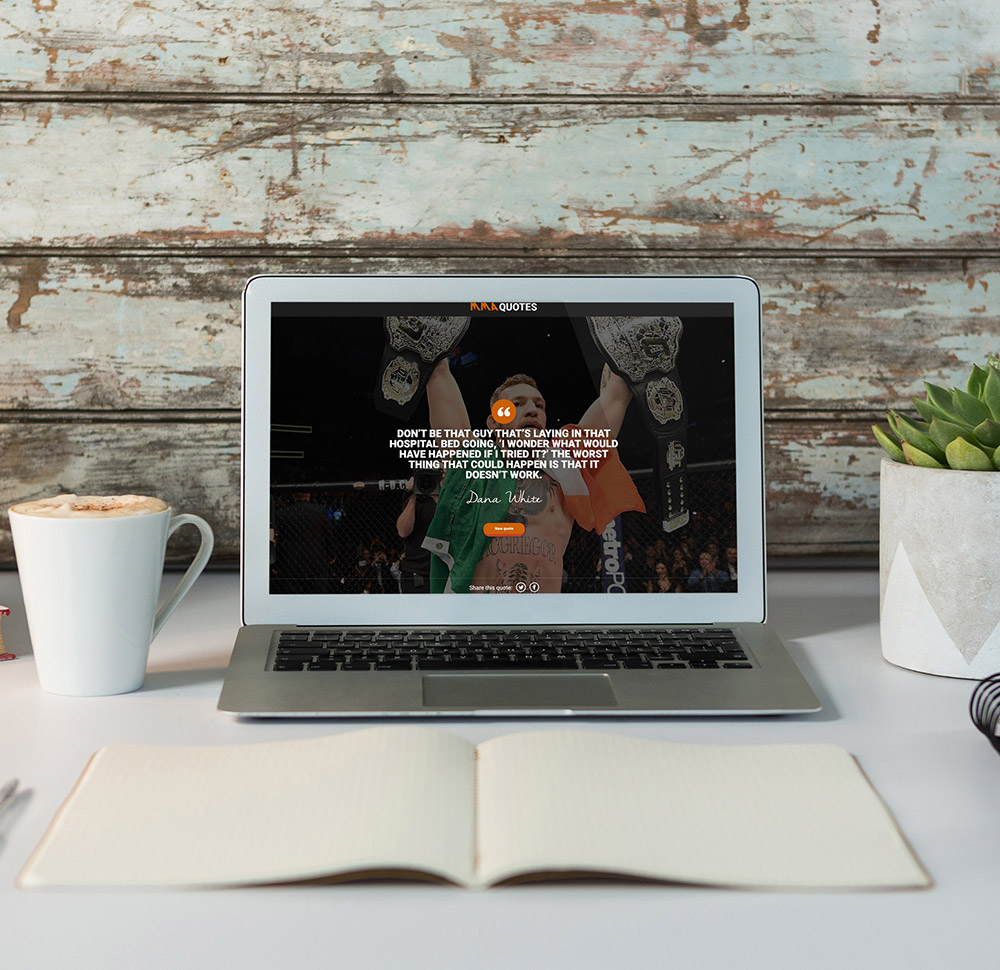
Overall, I am very pleased with the website’s current state but am also excited to continue building upon it and expanding its content to reach an even wider audience of MMA enthusiasts and those in need of daily inspiration.
Phase 2 (coming soon)
20 new quotes will be added
5 new background images
About page explaining the vision and purpose of the page
Submission page to allow you the ability to submit your own quotes
Creative Nerds is a digital design blog that I created to share my passion for design with the world. The blog publishes 2-3 blog posts every week, covering a wide range of topics from tutorials to Photoshop brushes. In 2022, I have published some great content that I am proud to have added to the blog. The content includes 160 seasonal icons, bokeh backgrounds, and much more.
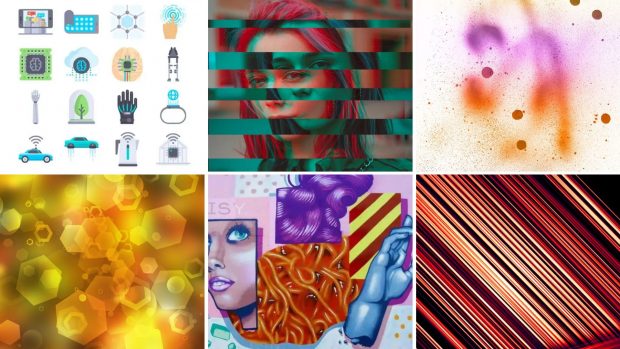
If you’re looking for design resources to use in your next project, you’re in luck! This post is jam-packed with high-quality resources, such as vectors, icons, Photoshop brushes, and textures, that you can use to take your design to the next level. Whether you’re a professional designer or just starting, there’s something for everyone to enjoy. So, sit back, relax, and let me take you on a journey through the world of design.
This is a tremendous icons. The set has been designed exclusively for Creative Nerds readers by the amazing guys over at Free Pik. The icon set includes 160 icons with icons for each season spring, autumn, summer and winter. The icons come in both png format and svg so that the icons look crisp and smooth on mobile and retina devices. Not to blow our own trumpets, but this icon set is truly one of a kind and one of the best free icon sets out there.
This edition 2 of our colorful spray paint texture we released last year. This is a great high resolution spray paint texture 2000px by 2000px. The texture is perfect for a wide range of design projects from print to digital design. Its a great texture your really enjoy using throughput projects 100% free to where ever you please.
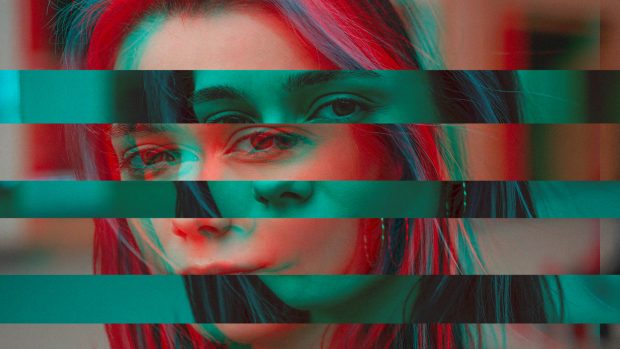
This is a short video tutorial sharing with you how to create a glitch photo effect using Photoshop. Its a great simple effect, and easy to follow tutorial for creating your very own flitch effect. The technique can be applied to almost any photo of your choosing. This is good effect your really enjoy using in future projects and artwork.
This is great colourful hipster triangle geometric pattern set. This is the perfect pattern for all types of design projects and artwork. The pattern would look great in print design and digital design projects. The pattern comes in 4 different colors to choose from to use. Theres EPS and AI vector format all to choose from to open in your favourite vector editor.
This is a great hexagon bokeh texture, which is a beautiful resource. This a great 100% free texture we are really please to add to add to our library of free textures. I hope you enjoy using the is texture, and don’t forget to check out the rest of our textures.
Photoshop is an industry wide used design tool when it comes to editing photographs the majority of phot edits you see online or within print can be recreated using Photoshop. This tutorial we are exploring modern photo effects that can be recreated using Photoshop. All the tutorials featured are step by step tutorials to guide you through the process. There a range of tutorials included from how to create an hand drawn pencil effect to how to add light leaks to your photographs.
This is a great squared plaid style scalable seamless vector pattern. The pattern comes in four different colors to choose from to use through out your design projects. Theres two different vector formats to choose from to use. The pattern set is perfect for personal and commercial design projects. Download for free and start enjoy using through out your artwork.
Creative Nerds is our premium membership subscription service where you get access to hundreds of design resources from Photoshop brushes to vectors. This post we have cherry picked 10 of our personal favourite Photoshop brushes we currently have available to download for free as part of your membership.
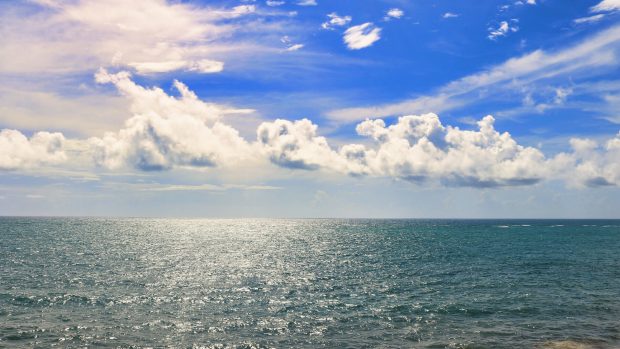
Unpslash is a library of free high-resolution photographs contributed by thousands of photographers. We have our very own Creative Nerds Unpslash profile, and are very proud to announce we have reached a major milestone of over 2.7+ million views combined. We have put together this short post to showcase a cherry picked collection of just a handful of the free photos we have available to download.
This is a great abstract photoshop brush set a must downlod if your a lover of photoshop brushes. Each brush is 4000px a high resolution size perfect to use in print and digital design projects. The brush set contains 4 unique brushes to choose from to use across your design projects and artwork.
This another is a tremendous icon set courtesy of the great folks over at Free Pik. The icon set includes a jaw dropping 44 unique technology of the future themed free icons from robots to rockets a wide variety of various types of different cool fun icons. The set comes in both SVG and PNG format perfect for your any type of digital or print project. This is certainly a must download resource your’ll really enjoy using in your web projects.
This post is a collection of must watch YouTube channels for design for enhance your design skills and learning some great new techniques. All of these YouTube channels cover step by step design tutorials for Photoshop, Sketch, InDesign, Illustrator, etc a broad range of modern design tools to help further develop your design skills.
This a a free photoshop brush set, which contains 4 oil splatters stains. Its large hi-resolution photoshop brush ser with each brush in the set 2500px by 2500px. Its a great versatile brush you can incorporate in print and digital projects. Its a great way to apply a authentic oil stains effect to your designs in a matter of seconds.
This is an authentic pipe smoke photoshop brush set, which is a great way to apply an authentic smoke effect to your artwork. Its a high resolution brush set so can be used in both print and digital artwork projects.
A colorful free petal seamless pattern set, which contain 3 colorful choices to choose from. This is a great pattern, which can be used across both print and digital design projects. The pattern comes in both EPS and AI format to be used in your favourite vector editor. Its a great free pattern, which is 100% free your really enjoy using across your design projects.
Throughout the year of 2022, I have been continuously publishing a new design screencast every month. These screencasts have been a great way for me to share the knowledge and skills that I have acquired over the years, after having spent thousands of hours using various design applications. My goal is to help aspiring designers learn the fundamentals of design through easy-to-follow tutorials that cover a range of topics. Whether you are just starting out as a designer or are looking to enhance your existing skills, these screencasts have something for everyone. I have also received positive feedback from viewers who have found my screencasts to be informative, engaging and helpful. I am committed to continuing this effort in the future and look forward to sharing even more design tips and tricks with my audience.
Easy ways to cut out people or objects using Photoshop 2022
How to create a glitch effect using Photoshop
3 features of the content aware tool you should know
An easy way to quickly create a duotone effect using Photoshop
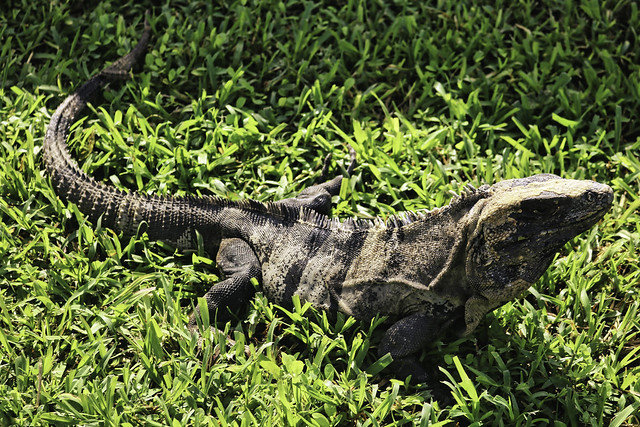
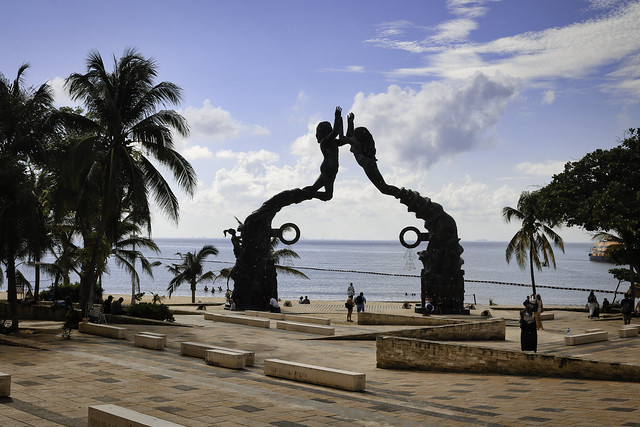
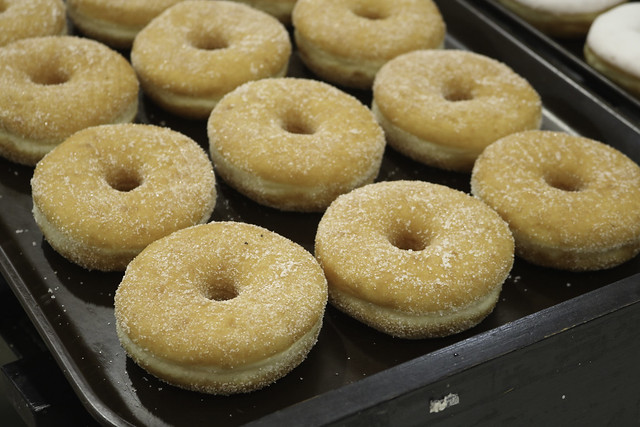
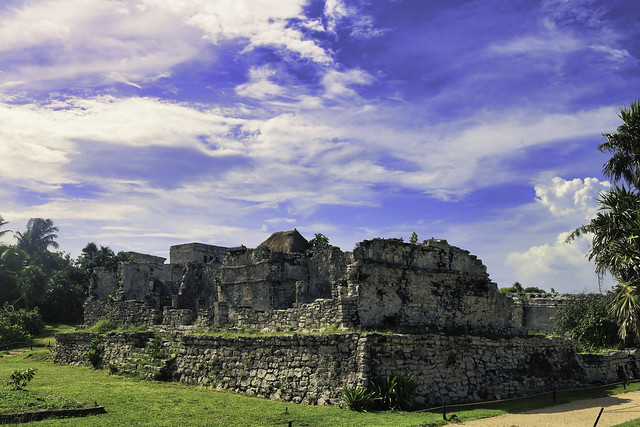
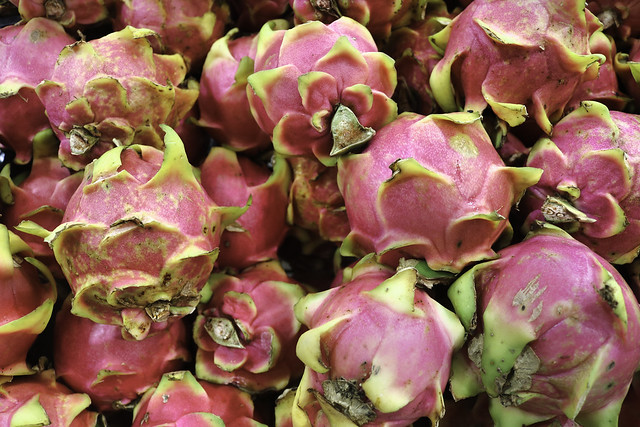
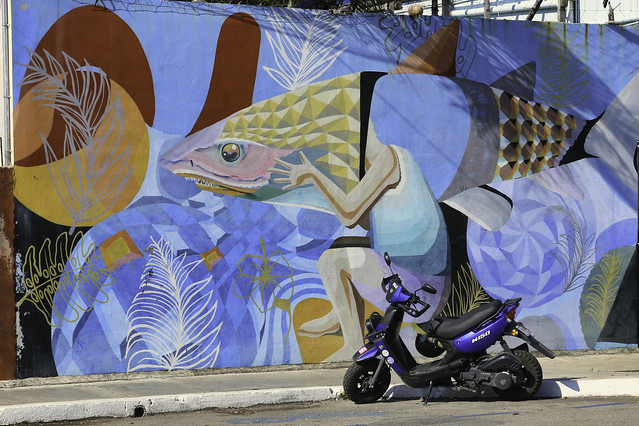
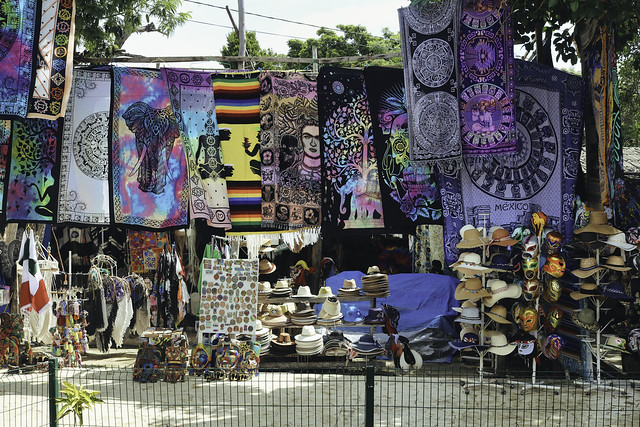
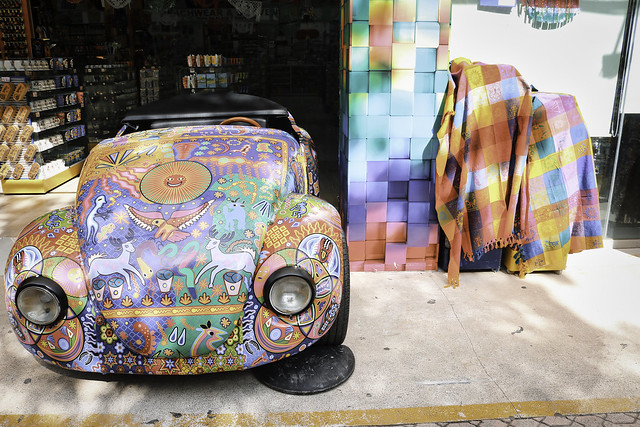
I recently spent 2 weeks traveling in Mexico, exploring the rich culture and history of this beautiful country. From the vibrant colors of the bustling markets to the stunning architecture of the ancient ruins, every moment was a feast for the senses. As usual, I brought along my trusty camera to capture the essence of my journey and add to my personal Flickr travel library.
Below is a selection of my personal favorite photos from my Mexico trip. Each one tells a unique story and captures a special moment in time. Whether it’s the joyous laughter of a group of children playing in the streets, the breathtaking beauty of a mountain range at sunset, or the intricate details of a centuries-old temple, these images are a testament to the incredible diversity and richness of Mexican culture.
But the journey doesn’t end here. I still have countless more photos to edit and share with the world. Over the next few weeks, I’ll be working hard to prepare these images for publication on Shutterstock and Deposit Photos, where they’ll be available for purchase by anyone who wants to bring a piece of Mexico’s magic into their own home or office. So stay tuned for more updates, and get ready to experience the wonder and beauty of this amazing country for yourself!
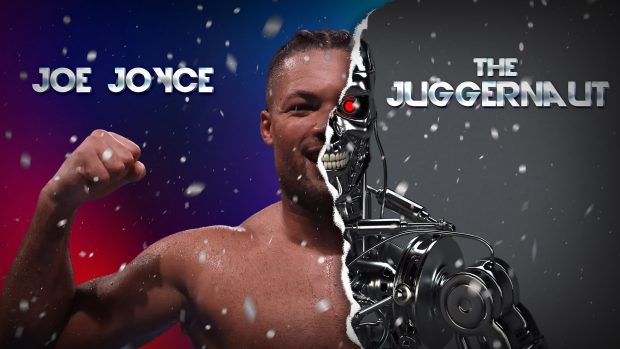
When I first started designing, I would frequently engage in creative photo manipulations without a specific goal in mind. As I progressed, however, I began to neglect this practice. In retrospect, I realize that photo edits can be an excellent way to fuel creativity and keep design skills sharp and current. It allows designers to experiment with different design elements, such as color grading, composition, and typography, without the pressure of a deadline or client expectations. It’s also a great way to explore new techniques and tools while honing existing skills. Incorporating photo manipulations into the design process can ultimately lead to more innovative and unique design solutions. Therefore, it is essential to make time for creative experimentation and explore different avenues for inspiration.
Background on artwork created
This photo manipulation is of Joey Joyce a British heavy weight boxer who goes by the nickname the juggernaut renown for his durability and great endurance, which at times has been compared to a robot.
Please click on the image to preview a large scale version