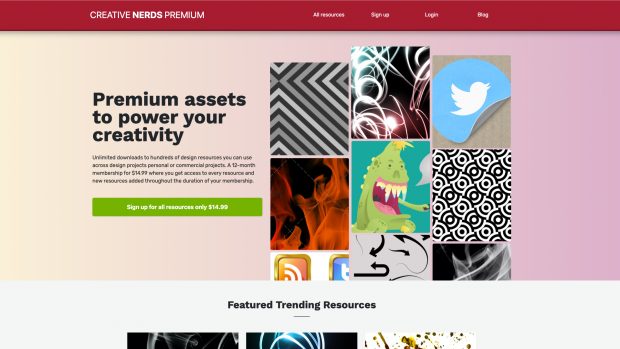
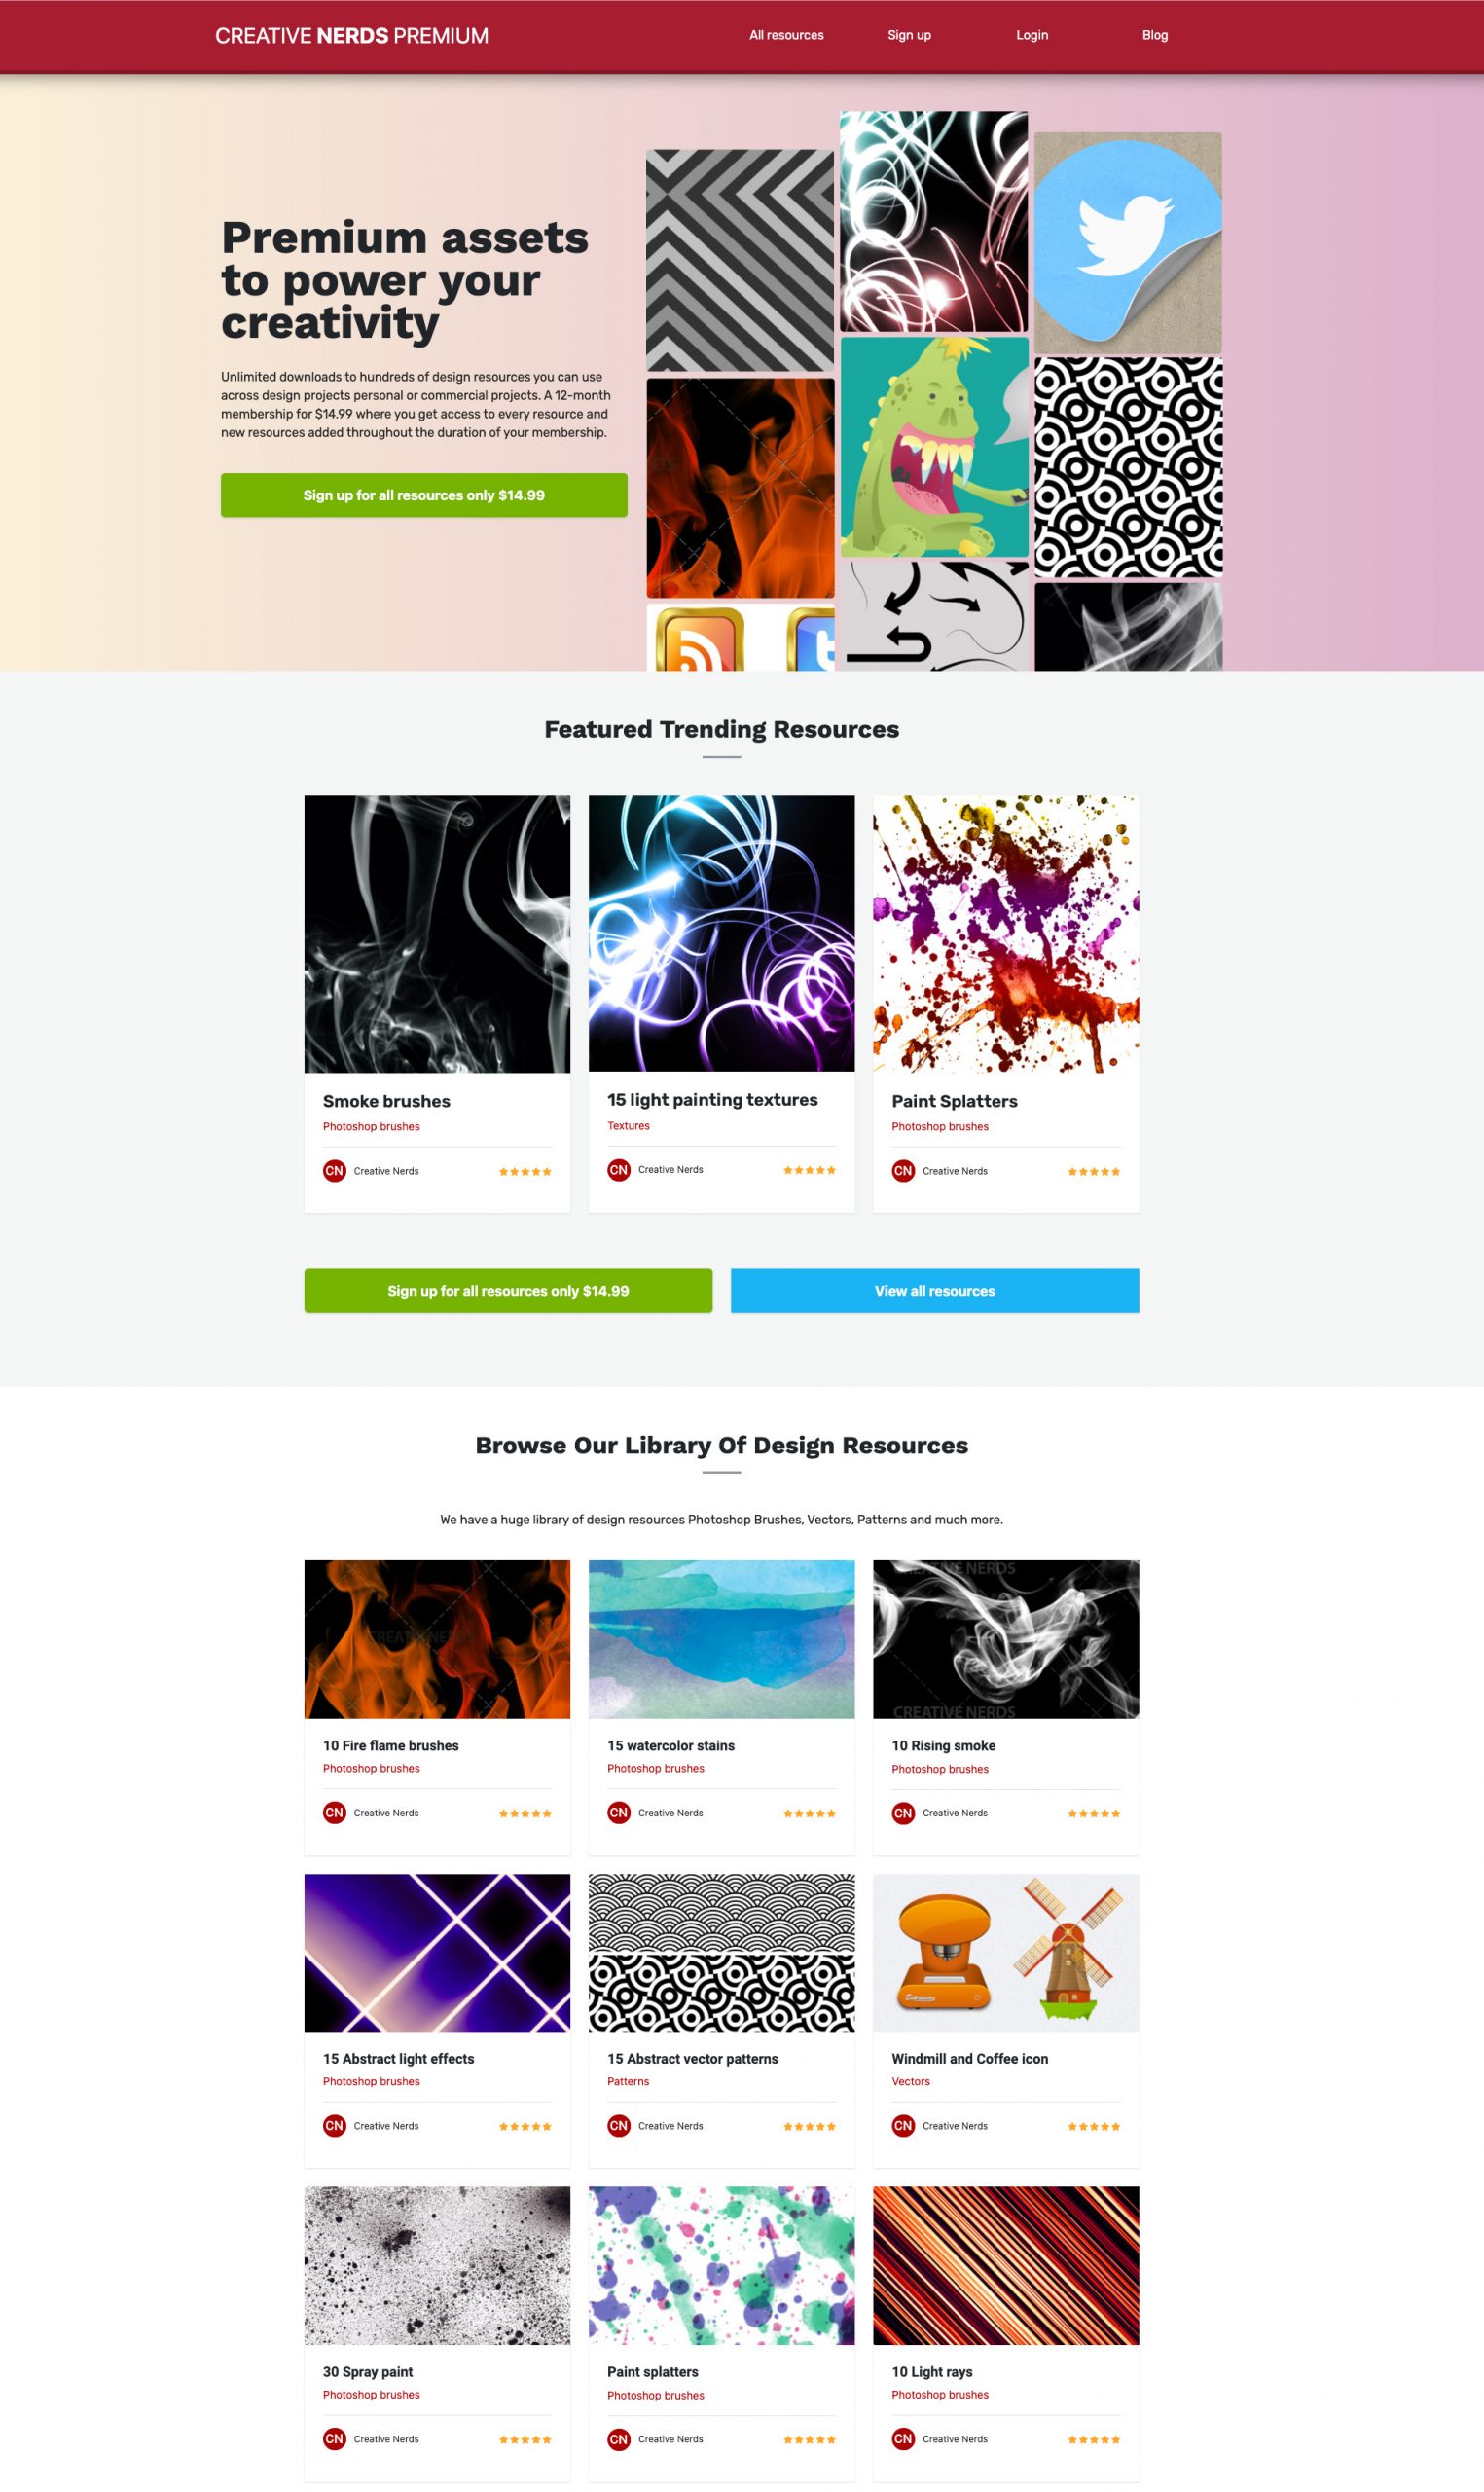
The past few months i’ve been very busy on working on the redesign of my digital design subscription service Creative Nerds Premium. CNP model is you pay an affordable $20 for a 12 month subscription where you get access to 100’s of resources you can download and use in your design projects commercial or personal. The website has 100s of design resources from Photoshop brushes to seamless vector pattern to choose from to use.
Creative Nerds Premium
Check out Creative Nerds Premium and become a member today for a limited time discount price of $14.99.
Creative Nerds is my digital design blog where I publish 3 blog post’s a week a wide range of posts from tutorials to photoshop brushes. 2021 I’ve published some great content, which I’m proud to have added to the blog. This post I’m sharing some my personal favourite post I published on Creative Nerds throughout 2021. 1000+ free design resource bundle – Limited time
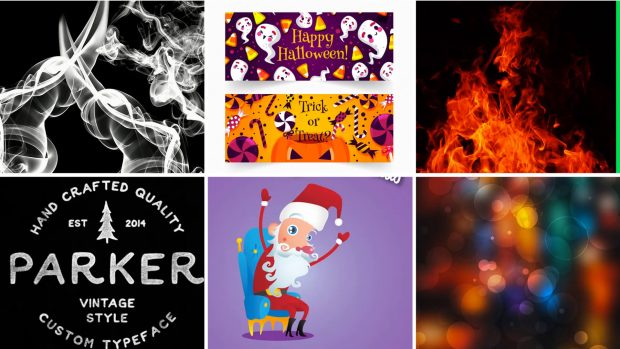
This post is jam packed with design resources to use in your next design project. There’s vectors, icons, photoshop brushes and textures. A range of high quality resources to enjoy. The bundle is exclusive to subscribers part of our newsletter.
This is a great authentic fire flames texture, which is a great free texture to use across your digital design projects and print artwork. This has to be one of the best ways to add an realistic fire effect across your designs. Its a texture we enjoyed creating and hope you apricate using across your designs. The texture 3000px by 3000px. The texture is 100% free to use however and where ever you please.
Good free fonts to use across design projects can be a very challenging task. There some great free fonts out there, and this post is a great compilation of very best free vintage and retro you can download.
Video stock photography is a great way to incorporate some free stock video footage from broad range of various clips into your web project. This post we cherry picked the very best places for finding HD quality free video footage you can download for free and start using in your projects.
This a great free texture to use across your design projects. Its a black and white texture an authentic smoke background. The texture comes in a jpg format. The texture is 2500px by 2500px. A great free texture to download and instantly start using however you please including commercial or personal design projects.
This is an watercolor paint effect brush set, which is a collection of 5 authentic paint blots for applying a great realistic paint effect to your designs, whether that be digital or print. The brushes are a large scale brushes great for high resolution design work.
This is some great creative inspiration to get your creativity flowing. The post is a collection typography and lettering designs in the form of inspirational quotes. This post is a great source of inspirational not only is it showcasing world class artists, but creative typography with a motivational quote to inspire and motivate you when designing. The post includes a range of artists specialise in typography, please click through and view there portfolios there’s outstanding artists featured in this post.
This illustrator tutorial we will be sharing two techniques for creating unique vector geometric vector shapes in seconds. The tutorial is in the form of a video screencast to make it as easy, as possible to follow along with the tutorial.
This is a very colourful vibrant bokeh portrait texture to use across your digital and print project. This is a great color bokeh background to use in your artwork for web background or photomanipulation. There’s a wide range of use for where this texture can be used, its a great your really enjoy using.
A great way to broaden your knowledge as designer is to listen to podcasts while your working. Podcasts can give you some great insightful insight into design from the perceptive of other designers.
Halloween is certainly the spookiest day of the year, with that day rapidly approaching it would only be right to offer a free Halloween vector resource set to be used in your design projects.
This tutorial round up is a collection of illustrator tutorials, which each step by step guides for how you can create seamless patterns. The post includes a range of tutorials suitable for any skill level whether that be a complete newbie or veteran illustrator user.
This is a great a futuristic light painted background texture, which is 2500px by 2500px. This a great texture we are pleased to add to our huge library of free texture and background. This us a great free texture you’ll really enjoy using through out out your digital design projects. This is one of many free backgrounds and textures you can download from our free texture category.
A colorful seamless pattern set collection of vector patterns. It’s a great abstract pattern set perfect to use in print projects, as well as digital design. The set includes in total 4 unique patterns color schemes to choose from. The pattern comes in both EPS and AI vector format to choose from to use in your projects. The pattern is 100% free so you download and start using throughout your projects instantly however you please.
We’re only weeks away from catching Santa Claus in our houses. This tutorial will show you how to create a Crazy Santa illustration from sketch that I’ve made for it. This is also a complex guide for creating characters from sketch. Intermediate knowledge of Adobe Illustrator is advised.
This is a collection of Halloween free fonts perfect to be used in your Halloween festive design projects. Its an essential list of fonts perfect for being used in a wide range of different projects from a Halloween themed poster or a digital design project. All these fonts have different licence usage, so don’t forget the terms of use for each free font.
This is vol 3 to a popular photoshop brush set, which includes a collection of large scale spray paint brushes to use across your print and digital artwork. It’s a great free brush if you want the ability to apply an authentic spray paint effect to your design. This is a great versatile photoshop brush set that can be used in a wide range of different projects its a great brush set your really enjoy using through out your designs.
This set of icons features famous landmarks from all around world from Buckingham palace to the statue of liberty in new York city. If your looking for an icon set that represents landmarks look no further, as this is the perfect set . The set of icons comes in both SVG and PNG file formats, perfect to be used across both digital and print based projects.
This months post I’m revisiting all of the video tutorials I’ve recorded and published on Creative Nerds YouTube channel through out 2021. The video tutorials are a collection of both photoshop and illustrator tutorials. There short screencasts, which are aimed at beginners and intermediate users. The video tutorials are published on my main blog Creative Nerds, as well as YouTube be sure to subscribe or frequently visit my design blog.
How to create a color palette in illustrator in seconds
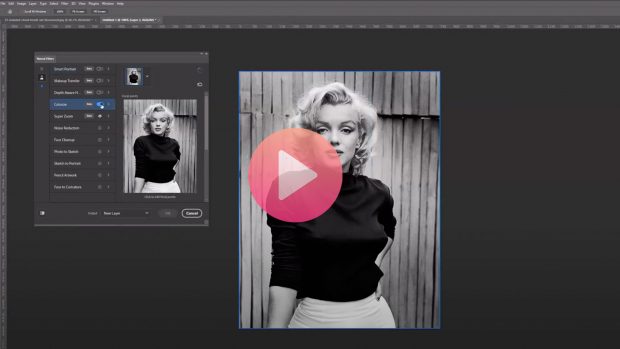
How to restore color to a black and white photograph
How to create a futuristic blur text effect
How to create unique gradient photo effect
How to apply sky replacement feature in photoshop 2021
How to quickly create unique shapes using illustrator
How to add text to shape a must know illustrator quick tip
How instantly age someone using this Photoshop trick
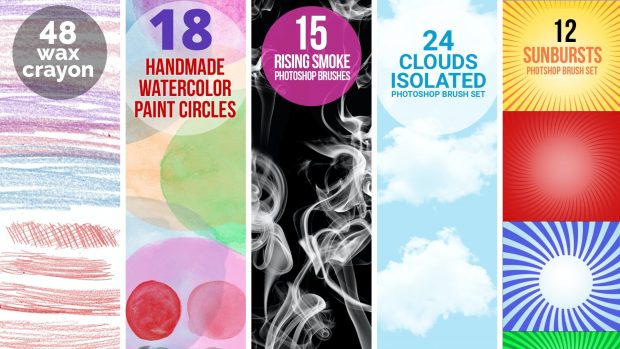
This is the biggest Photoshop brush set I have created. The brush is a collection of 100 unique isolated cloud brushes to use across your design projects. The brush set is available to purchase from Graphic River. The brush is a testing a new pricing point rather priced at $4 is $6, because its such a huge resource. A lot of time and effort goes into producing photoshop brushes, but is a very rewarding feeling once the resource is finished and available to purchase from my Graphic River market place.
This is a great new milestone reached on my Graphic River portfolio 600 sales. Its a really enjoyable process creating design resources, and have amassed a broad range of different design resources over on the graphic river marketplace from photoshop brushes to textures.
With only a couple months left in 2021 I thought I would share design resources I have created and are available to purchase.
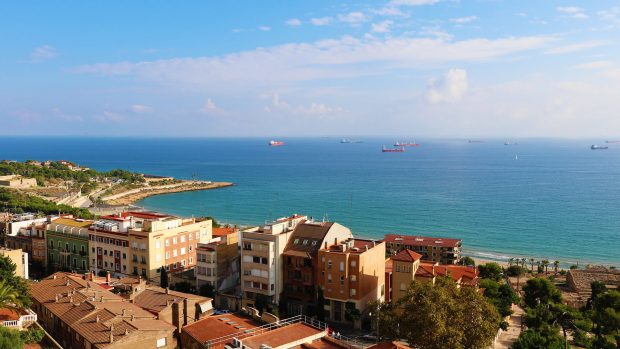
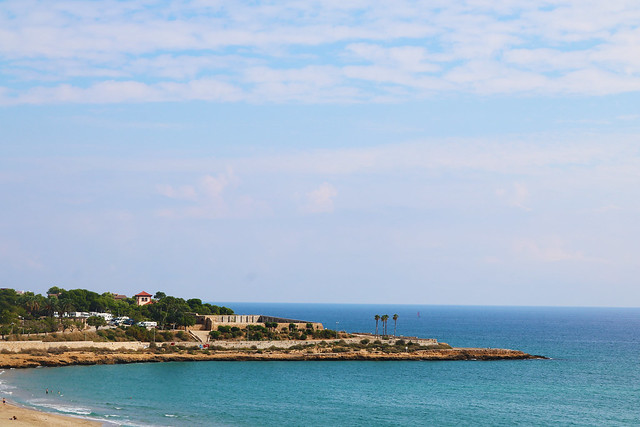
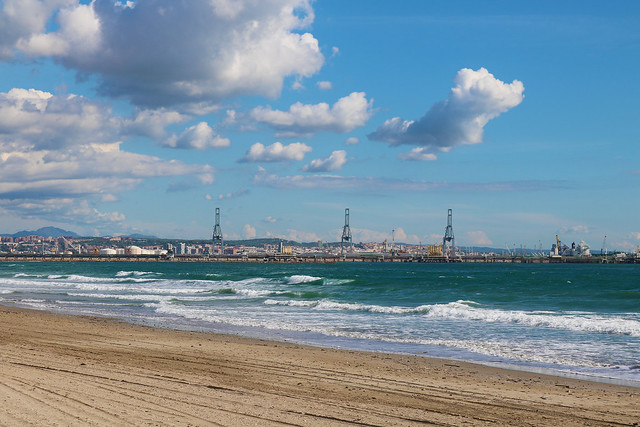
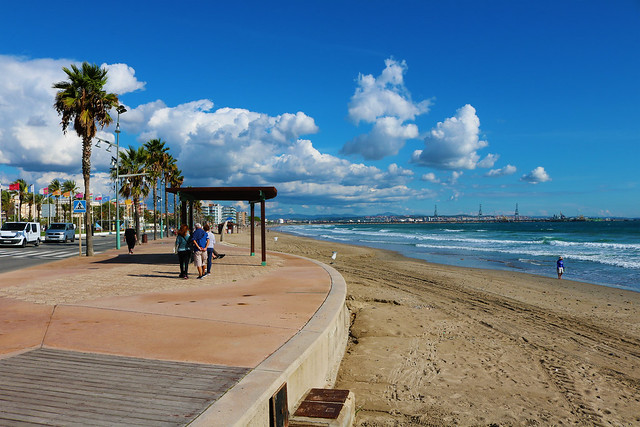
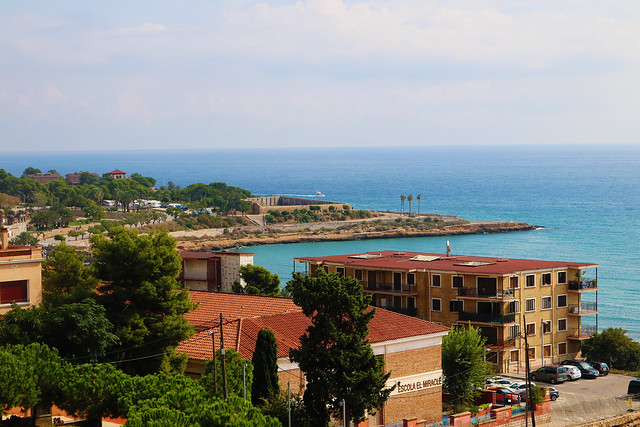
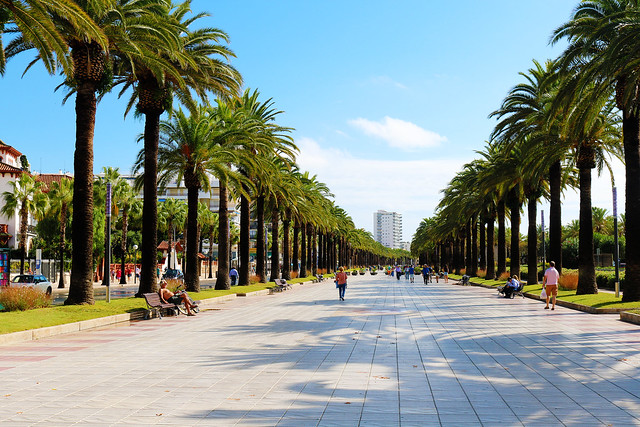
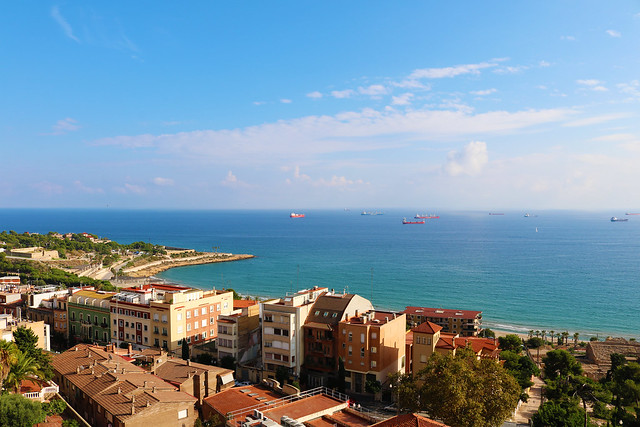
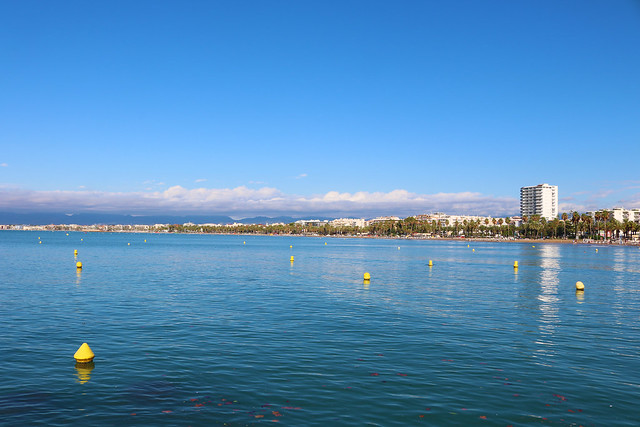
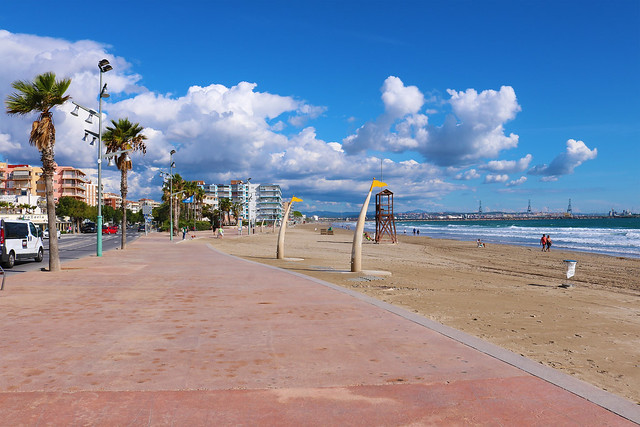
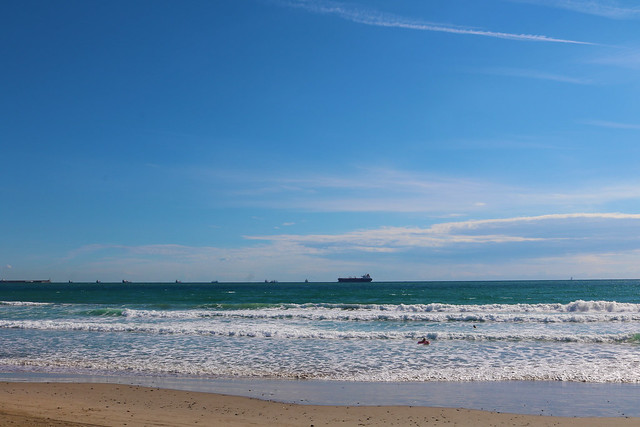
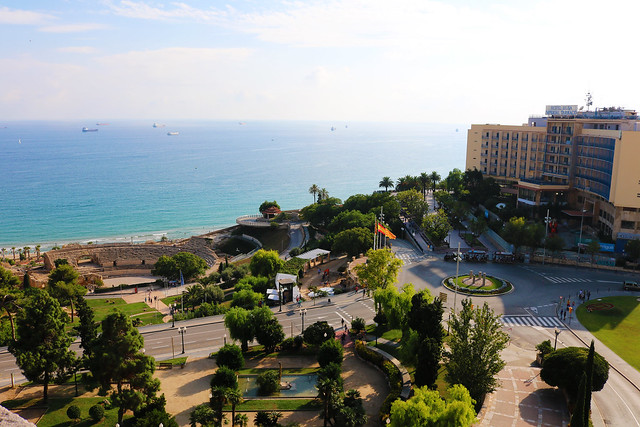
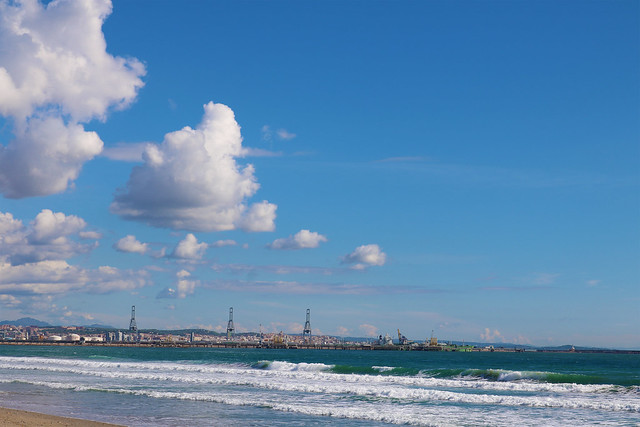
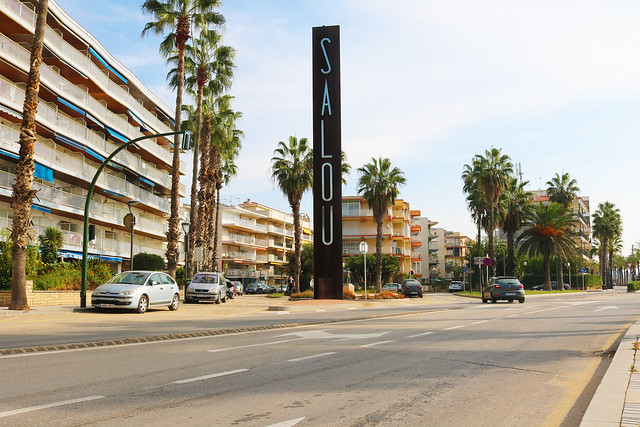
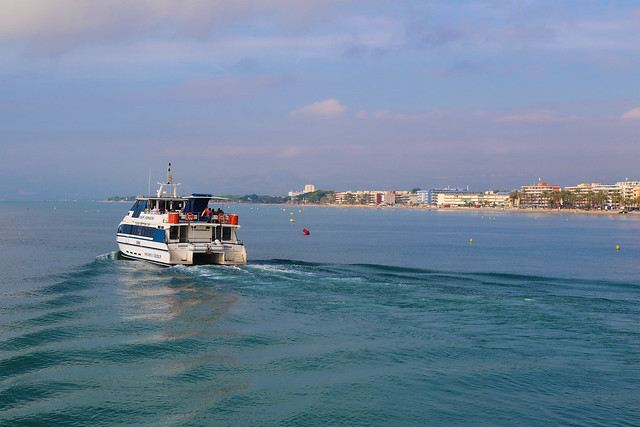
Since currently being in a world wide pandemic this has meant I’ve been unable to travel. Holidays and traveling is something I’ve learnt to now have a great appreciation for being able to unwind and take in different surroundings and culture. This post is flash back some photography captured when
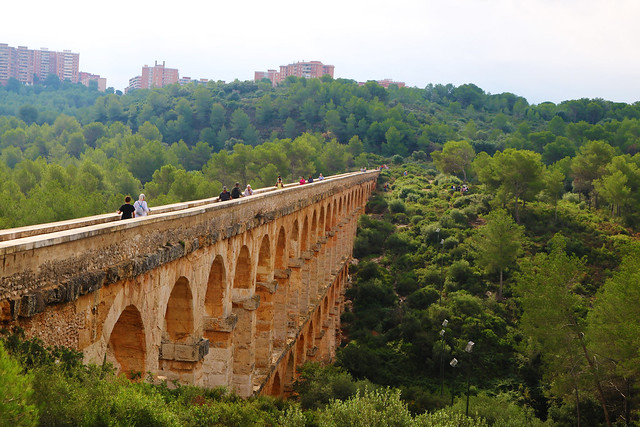
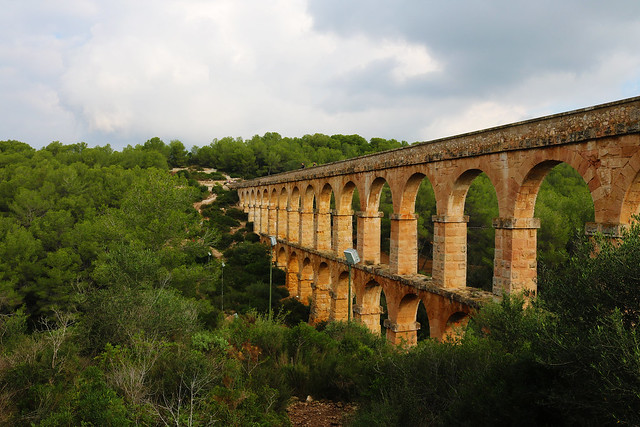
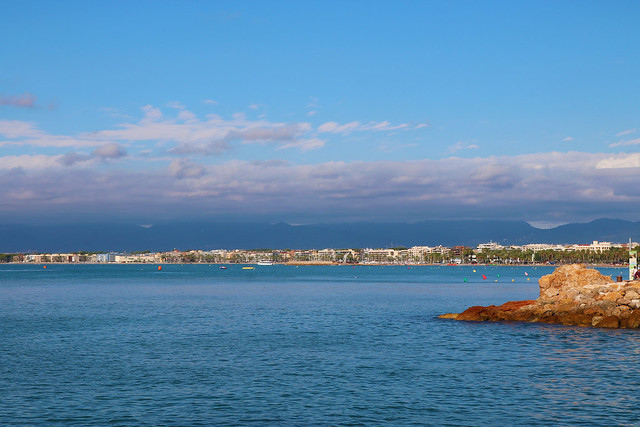
During my vacation I was fortunate enough to have the opportunity to visit the ancient roman city of Tarragona, which was once inhabited by romans 10,000 years ago. A lot of the ancient historical architecture is still in place, which the romans built all those years ago. It was fascinating to see, and one of the highlights my trip.


.jpg)