This has been an incredibly enjoyable project to have worked on the past few weeks. This is a new addition to the Timothyblake.com website. The new page is a Cycling Dashboard, which essentially acts as cycling diary capturing my last 30 bike rides and outputting some great stats on those bike rides, also map which shows a heatmap of last 10 bike rides.
The website uses my Garmin watch data, which I use for recording my bike ride the distance, elevation speed etc. This data is the synced with Strava. Strava has an API, which I’m currently using the API feed to pull through my cycling data onto a page.

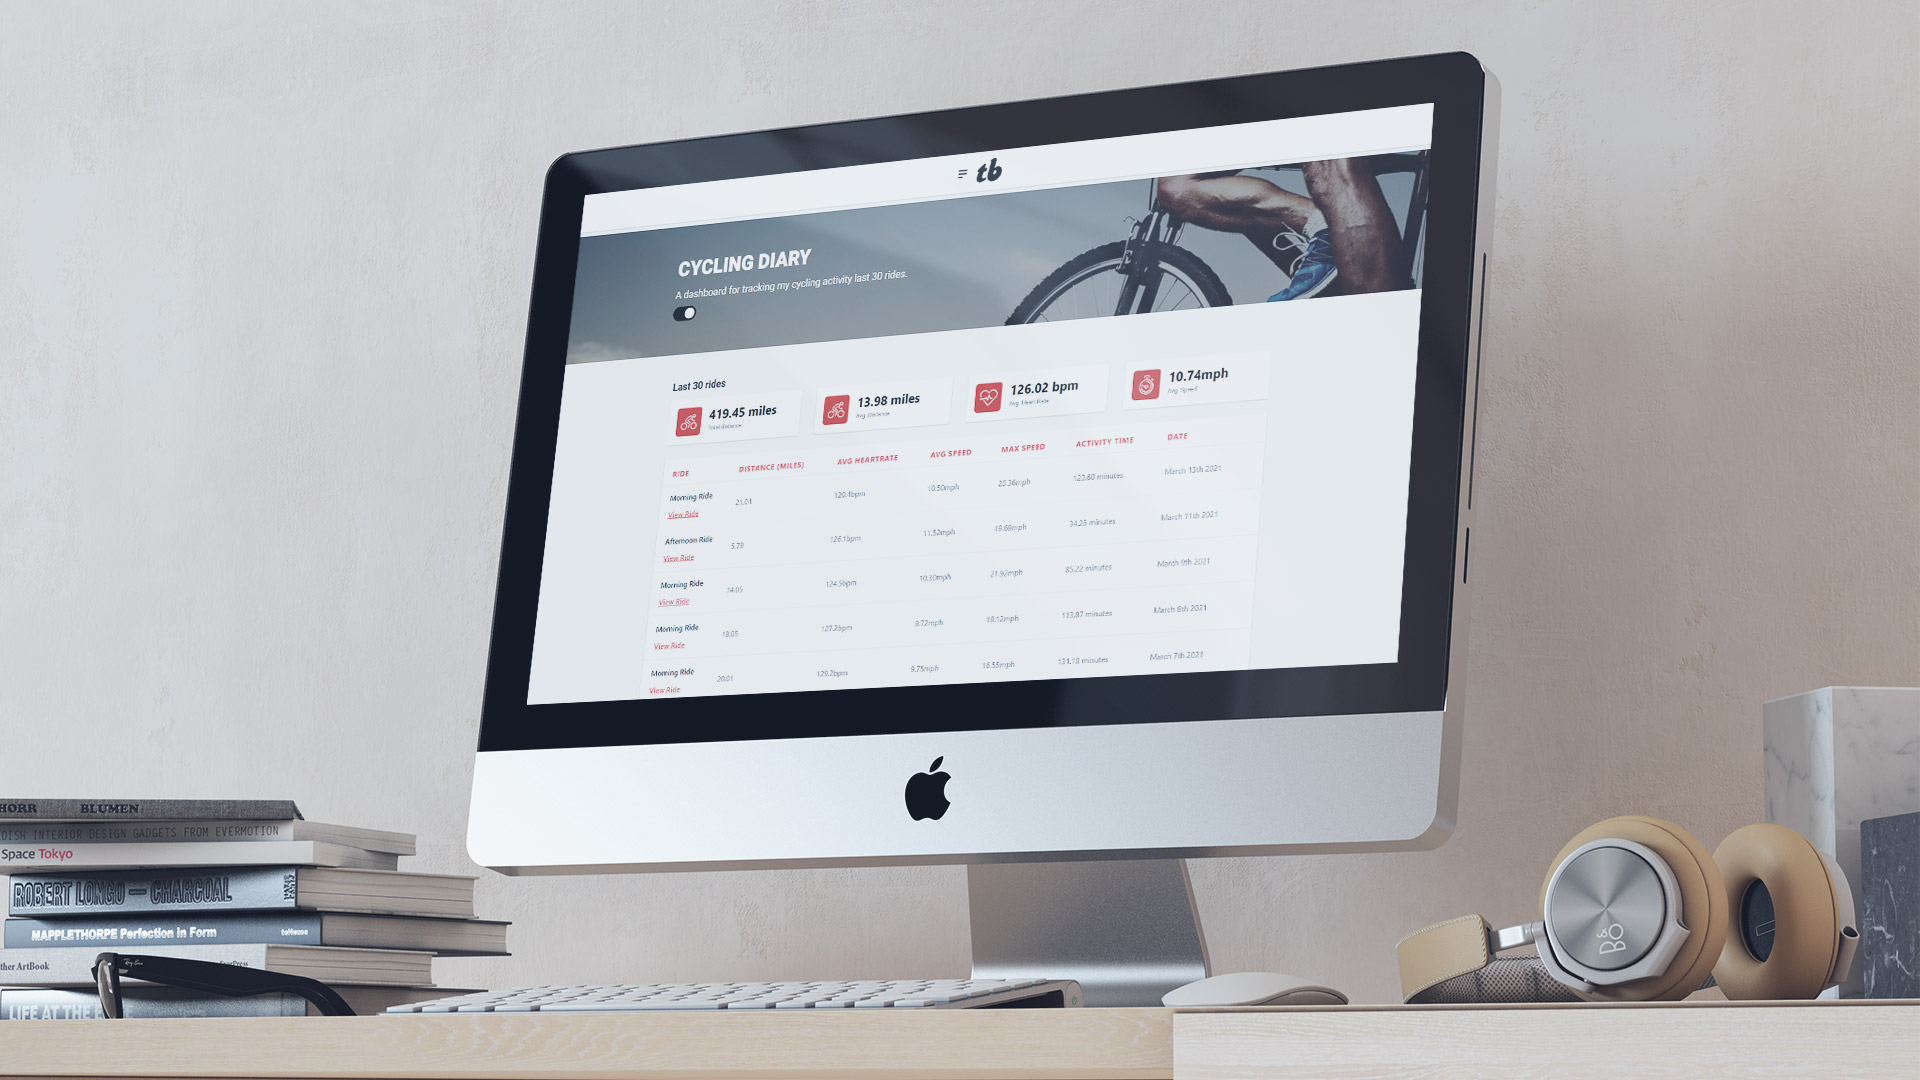
The cycling dashboard collates together my last 30 rides into a table allowing me have an overview to view of data on recent bikes rides the data includes ride time, distance, heart rate, speed, max speed, activity time and date. There’s also an induvial page for each ride, which breaks down the ride data even further, and displays a map of the route I cycled. This has been fun project and webpage I visit after almost every bike ride.