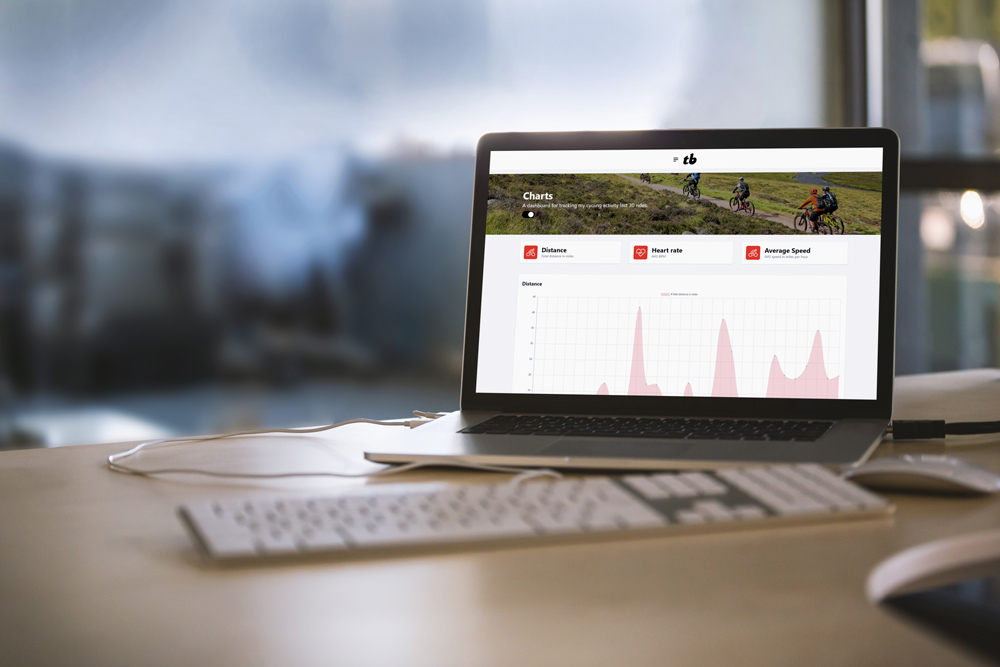
This is a new addition to my cycling dashboard, which i wrote about a couple months ago. The landing page showcases 50 of my last rides in three charts, which includes distance, speed and heart rate. Its a great visual way of viewing data collated all together to help analyse trends and patterns in my cycling. View charts dashboard here.
